What has always been annoying me with Xen, is that xentop is… well … a piece of shit! It just displays the current numbers of sectors or network bytes read / write. But as an administrator, what you care about, is to know which of your VM is taking all the resources, making your whole server starve. The number of sectors read/write since the VM has started is of very low importance. What you care about is to have an idea of the current transfer rate. And the same apply for networking.
So, tonight, within few hours, I hacked a small python shell script using ncurses to do what I needed, which tells how much resources have been used over the last 5 seconds (and not since the VM started). This way, it is easy to know which VM is killing your server.
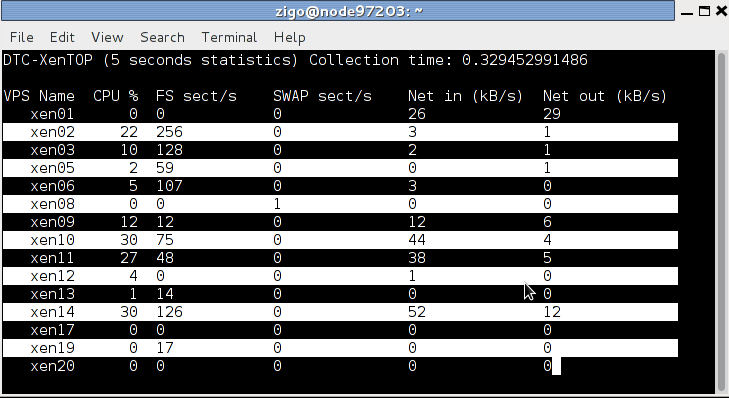
The script is adapted to my own needs only. Which means that it works only for DTC-Xen VMs of GPLHost. In my case, VM uses exactly 2 partitions, one for the filesystem, and one for the swap, which means that I display exactly that. I’m sure it wouldn’t be hard to adapt it so that it would work for all cases (which would mean finding out what device uses a VM and getting the statistics from /sys using that information, instead of determining it using the name of the VM). But I don’t need it, so the script will stay this way.
Before writing this tonight, I didn’t know ncurses. Well, it’s really not hard, especially in Python! It took me about 2 hours to write^Whack the script (cheating on the dtc-xen soap server which I already had available).